Statistical Table and Chart
by Ramki, Feb 10 2023

Solution:
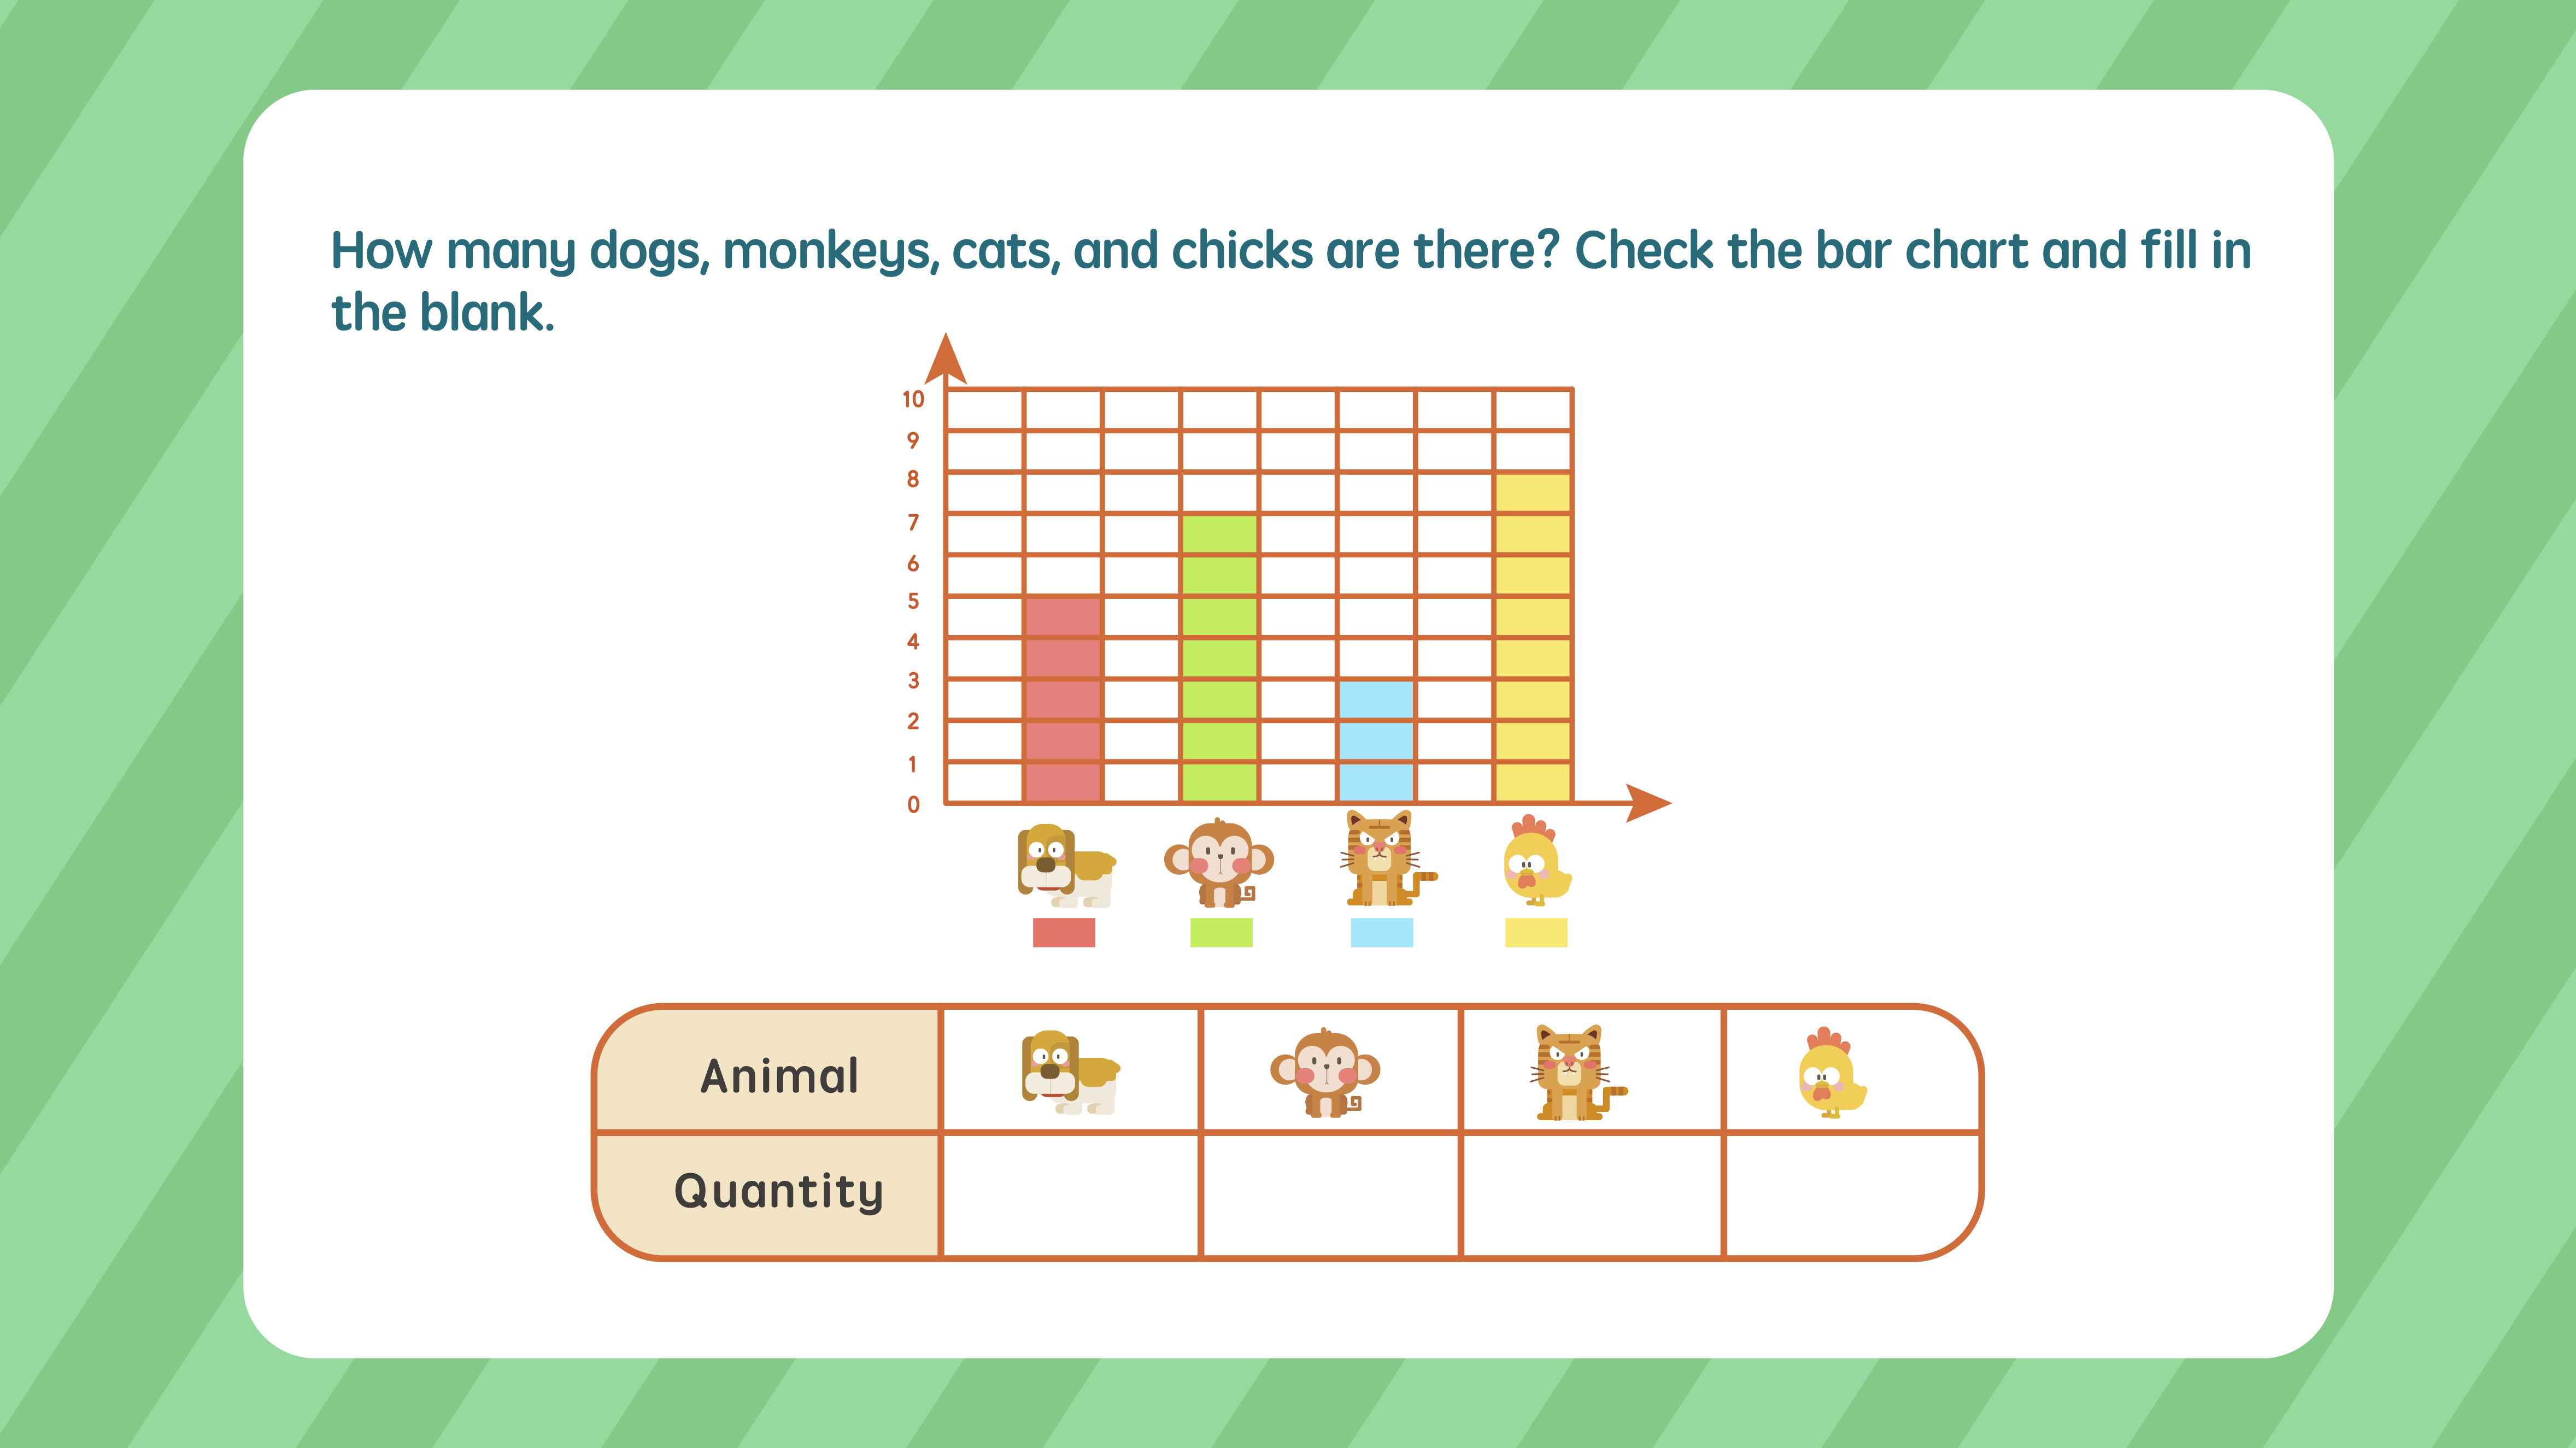
In a bar chart, the number of each item is represented by the colored spaces. Let's start with the dog. There are 5 red spaces above the dog, which means there are 5 dogs. Next, the monkey. There are 7 green spaces above it, so there are 7 monkeys. There are 3 blue spaces above the cat, representing 3 cats. Lastly, there are 8 yellow spaces above the chick, so there are 8 chicks.

Solution:
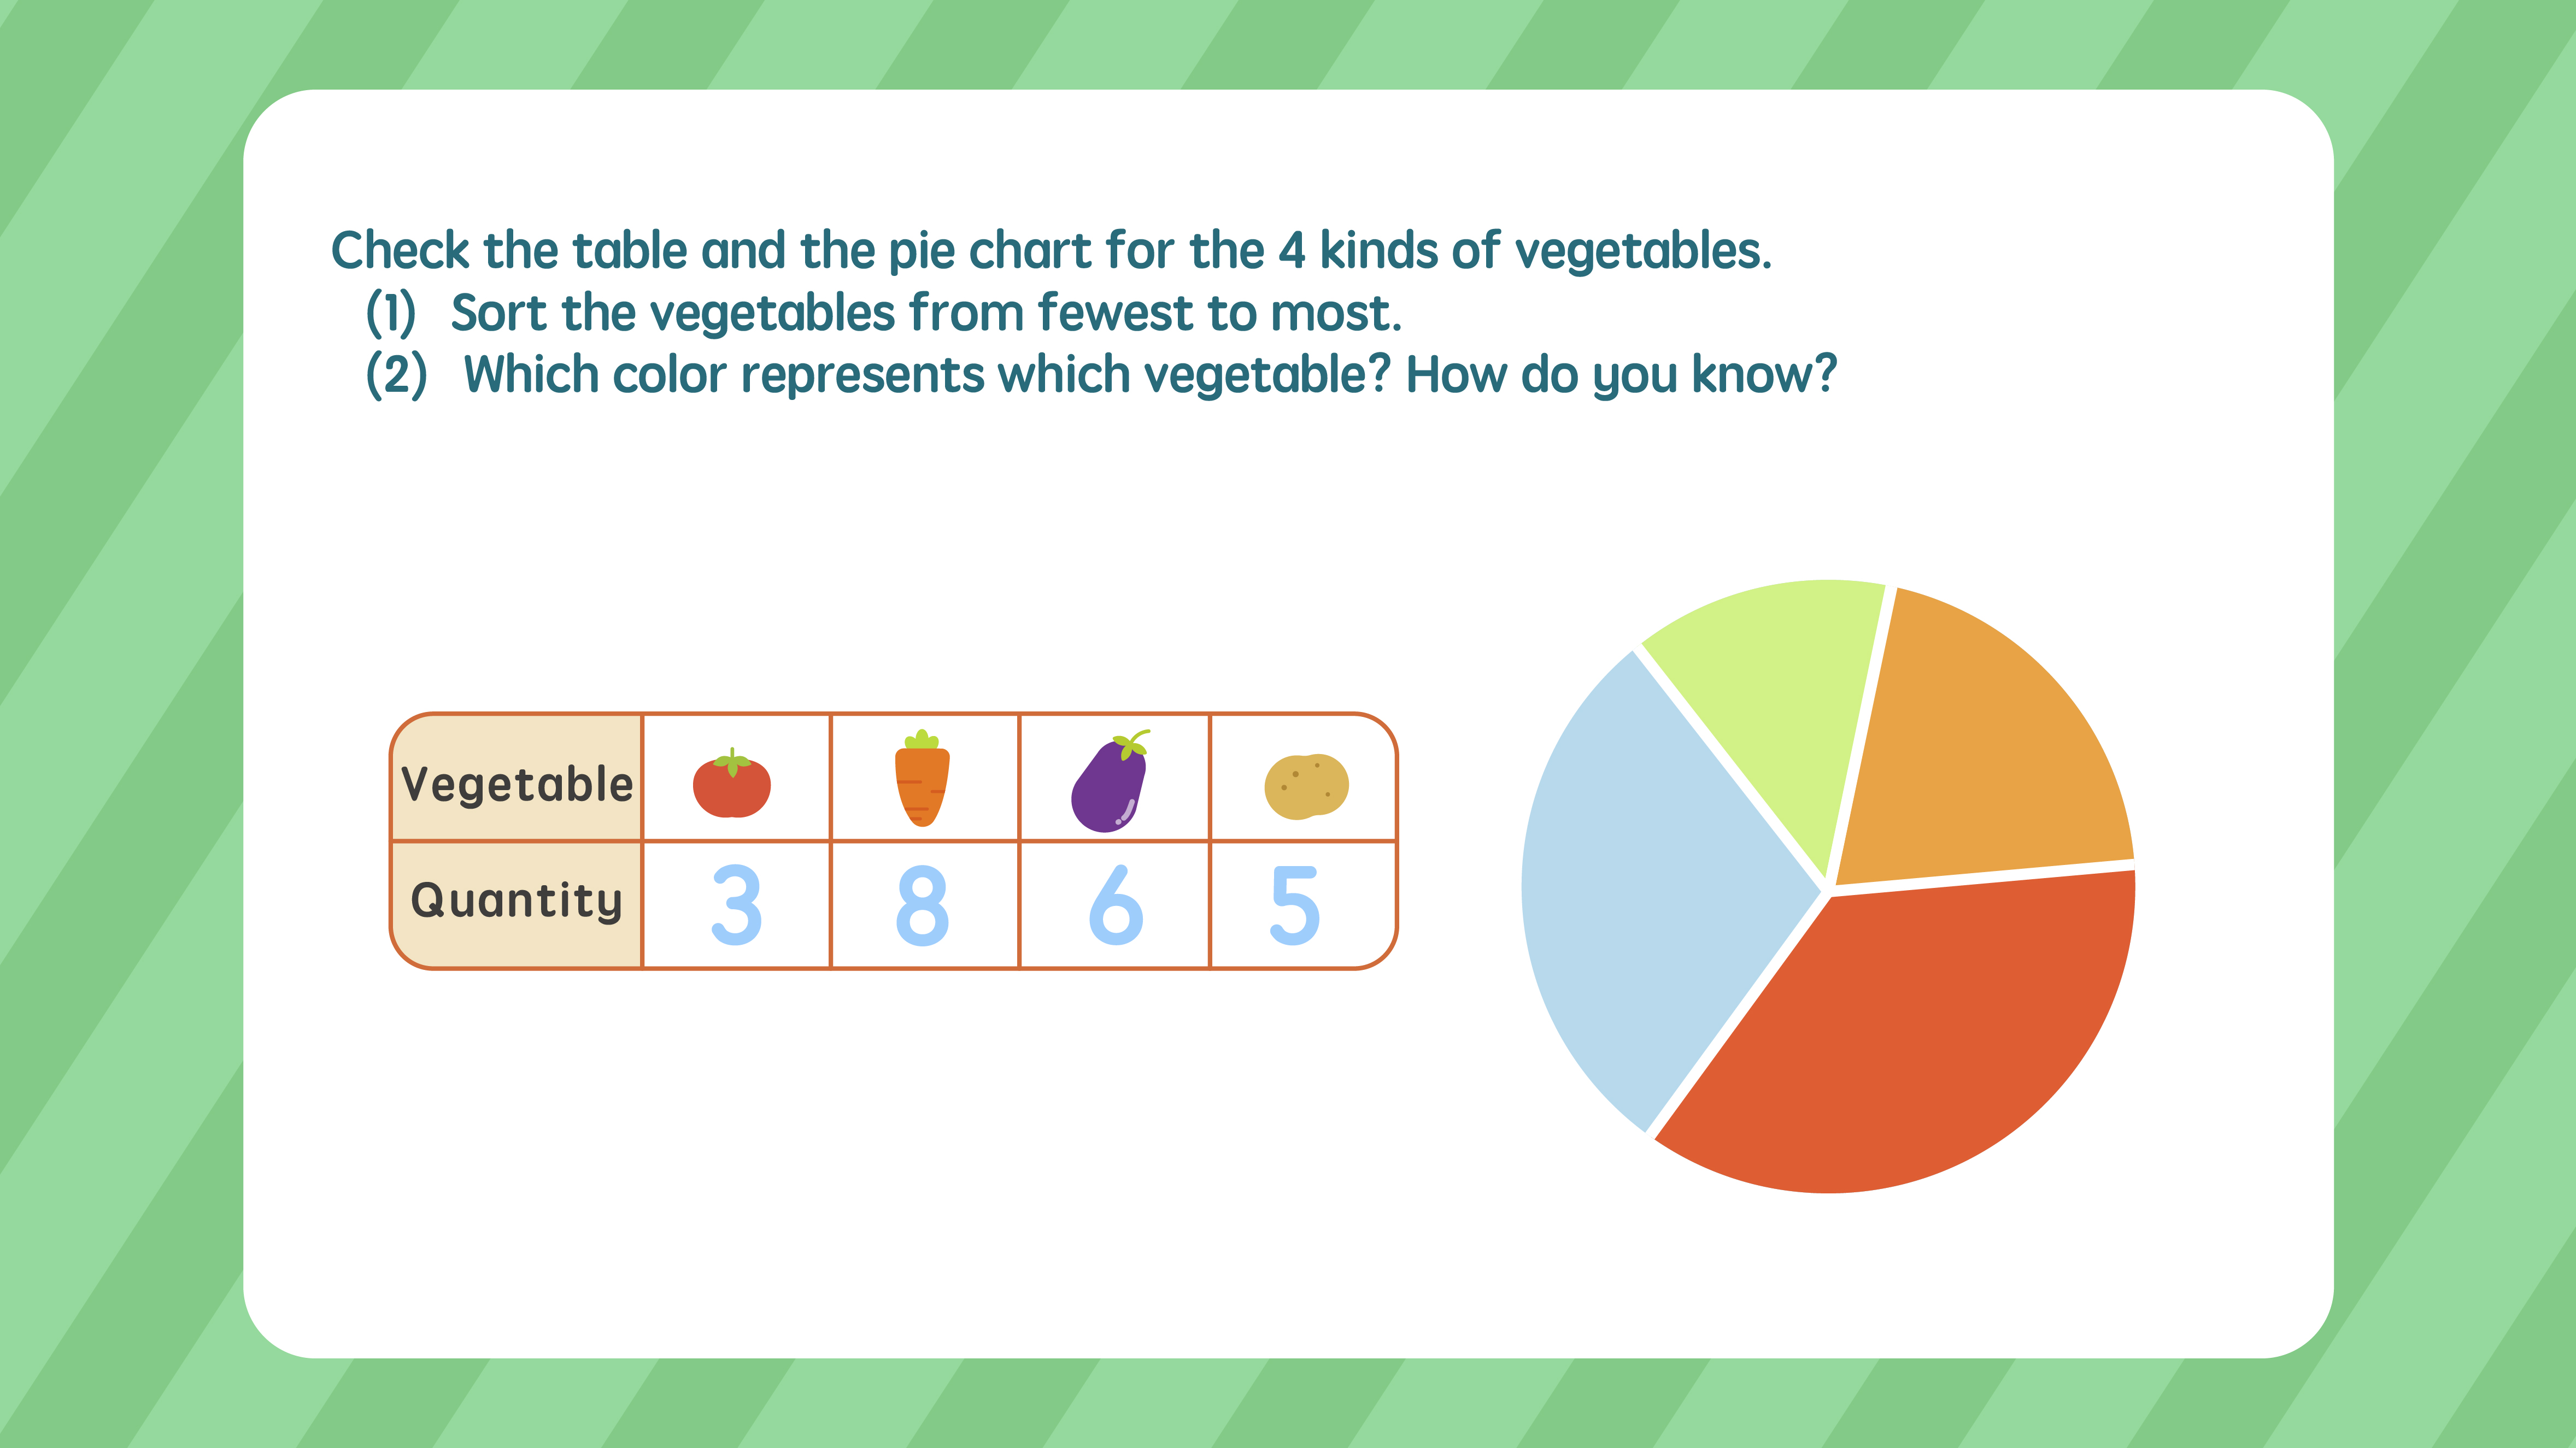
- In the table, the first row tells us what vegetable it is and the second row tells us the number of each vegetable. To sort the vegetables from fewest to most, just compare the numbers and put them in order: 3, 5, 6, and 8. So, from fewest to most, the vegetables are tomatos, potatos, eggplants, and carrots.
- In the pie chart, the more the vegetable, the larger area it covers. Let's compare the areas first. From smallest to largest, there are the green part, the orange part, the blue part, and the red part. They represent the numbers of tomatos, potatos, eggplants, and carrots, respectively.

 Successful